Salesforce Wave Connector – The new salesforce add-on for excel transforms an Excel spreadsheet into tables, charts and interactive graphs in the Salesforce Analytics Cloud. The Wave Connector can be easily understood. It helps create pivot tables, macros and visualizations. Using the wave connector, one can create datasets directly from the excel data. The connector takes care of complex data mapping to schema creation. All you need to do is login to your Salesforce account from the connector, select the required data from the excel worksheet and Submit. On doing this, the connector creates a new dataset in the Analytics cloud. You can use this feature to track key business information about customers, partners or employees. The data can be explored from any source. In fact, you can work on it from anywhere, i.e. from a desktop or mobile device. From the mobile app, with a single tap, one can import a raw data file and transform interactive visualizations directly on your phone.
The Wave Connector is available at the Office App Store.
Key features of the add-on are:
The Wave Connector is available at the Office App Store.
Key features of the add-on are:
- Sharing dashboards and lenses with colleagues
- Posting directly within Salesforce1
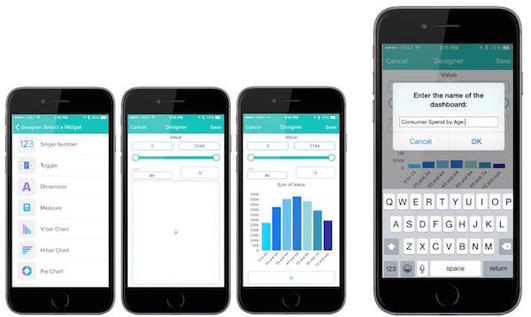
- Visualizing spreadsheets from mobile devices
- Send data over the Internet
- Read and make changes to your document